True cost of
living in the
United States
Our interactive tool checks which
cities and neighbourhoods fits
with your income and family needs
True cost of living in the
United States
Our interactive tool checks which cities and neighbourhoods
fit with your income and family needs
Why did we create this tool?
There are many cost of living rankings out there, but most of them give cost of living averages for the "average American household." Here's the issue - the "average American household" doesn't exist. Income and expenses vary widely between a single millennial to a household of two parents and three kids. Our cost tool explores the costs and expenses of living in a place based on your own, specific needs.
The True Cost of Living tool allows you to add details like household size, income, occupation, and even food preferences.
How Does it Work?
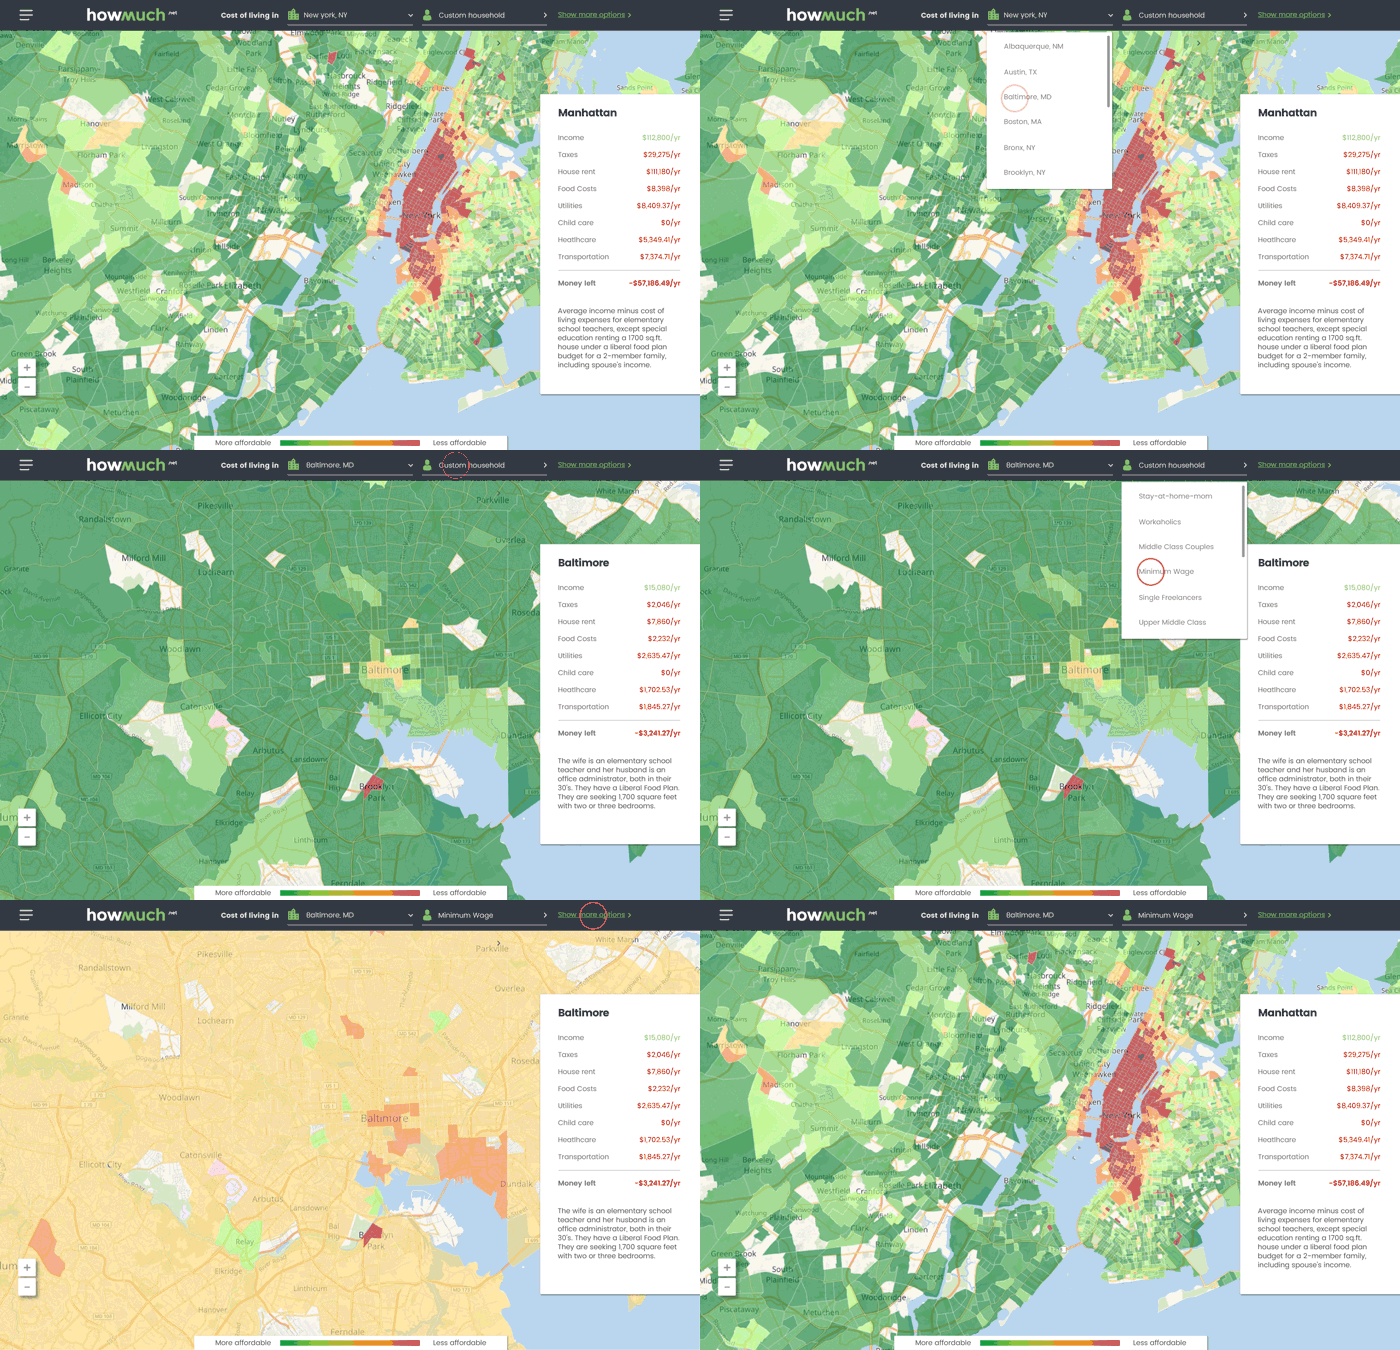
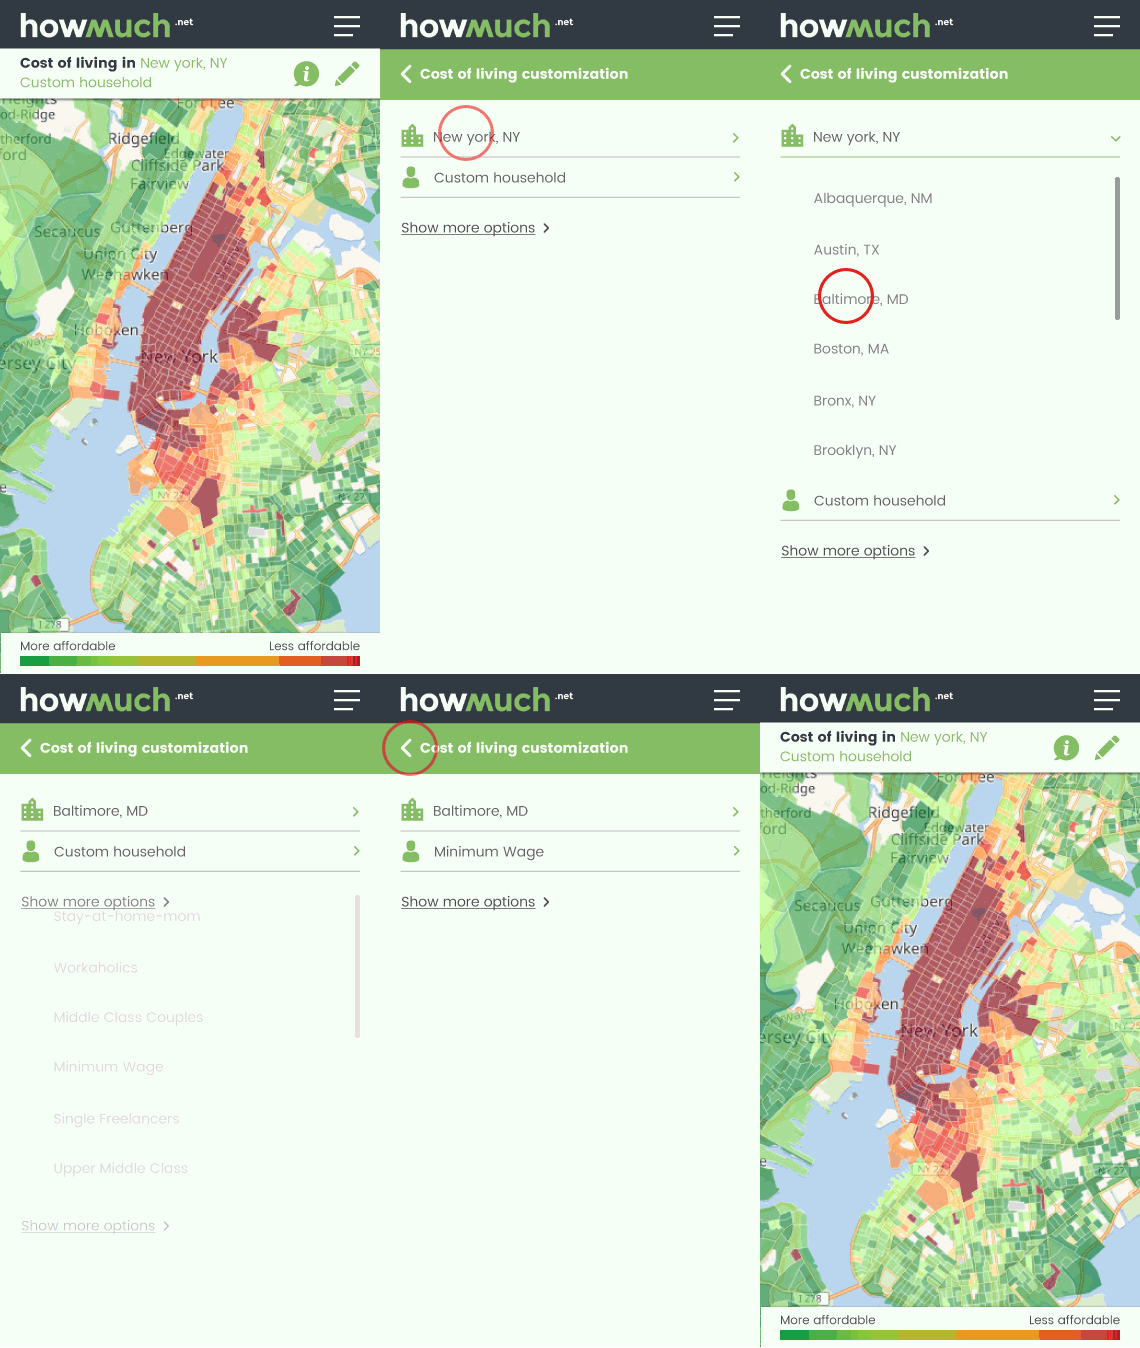
Find your True Cost of Living in a Few Clicks


Select your city
Select the city you are interested in
Browse and click
Browse through the map and click on the area you'd like to have more information about
Use advanced filters
If you're looking for more sophisticated searches, click on the cog icon for additional filters
Where do we get our data?
To make sure you're getting the best possible answers from our cost of living tool, we source our data from several places, and keep it updated to reflect the most accurate numbers we can. Here are some of our sources:
Income
This data is from the U.S. Department of Labor's Bureau of Labor Statistics and U.S. Department of Labor, Wages, and Minimum Wage database.
Taxes
Our Taxes data comes from the National Bureau of Economic Research. Our calculations tend to err on the side of safety - this means that the taxes we estimate may be higher than the taxes you actually pay if you live in that area.
House rent
Our data comes from Renthub.com, which provides us with statistical models that determine accurate market values down to the neighborhood level.
Food costs
We calculate food costs based on food plans created by the U.S. Department of Agriculture.
Utilities
We got this data from the U.S. Department of Labor, Bureau of Labor Statistics, Consumer Expenditure Survey, Public Use Microdata. It includes utilities, fuels, public services, and much more.
Child care
Our Childcare costs are based on the Parents and the High Cost of Child Care.
Healthcare
This includes all healthcare and personal care products and services as reported by renters in the Consumer expenditure survey
Transportation
It includes all transportation costs as reported by renters in the Consumer expenditure survey.


